Companion@360 → 7 Month programme to sharpen your writing skills → REGISTER NOW

Thalinomics
Amid the pandemic, thali prices exhibited significant variation among the states. The Economic Survey, however, said that the easing of CPI-C is expected to ease thali prices going forward. The Economic Survey 2019-20 offered a simple way of looking at the economy — thalinomics.
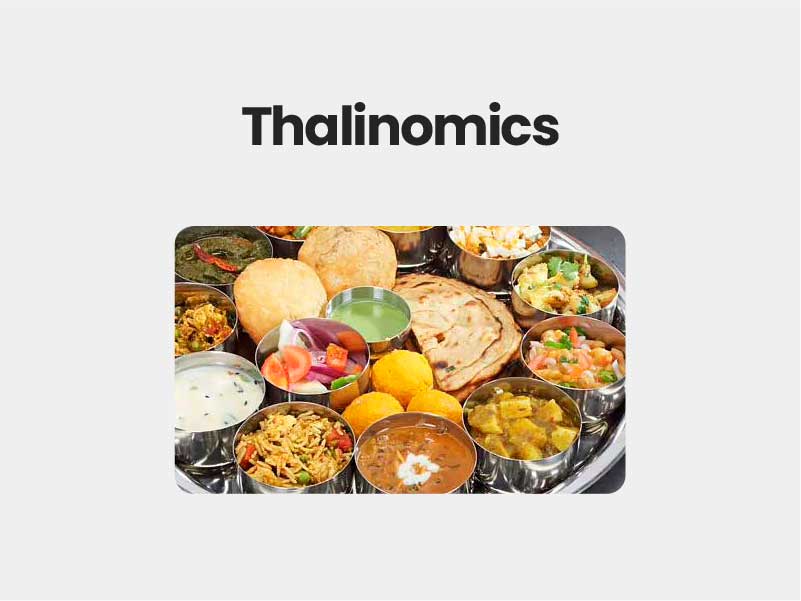
What’s in the thali ?
-
- As the name suggests, the concept helps the common man gauge at the economic situation of a country through something as simplistic and easy to understand as food.
- This year too, the Economic Survey 2020-21 looked at the cost of a plate of food in the country.
- This year’s thalinomics shows that thali prices for both vegetarian and non-vegetarian thalis declined significantly in January-March period, while rising sharply in April-November period in both rural and urban areas. Thali prices eventually eased in December.
- Amid the pandemic, thali prices exhibited significant variation among the states. The Economic Survey, however, said that the easing of CPI-C is expected to ease thali prices going forward.
- In June to December in the past year, the most expensive vegetarian thali in rural areas was in Andaman and Nicobar Islands at Rs 38.7, while the cheapest was in Uttar Pradesh for Rs 23.10.
- The most expensive non-vegetarian thali in the same period as in Arunachal Pradesh for Rs 48.50, while the cheapest was in Chandigarh for Rs 29.90.
- When it comes to urban areas, the most expensive vegetarian thali in June-December period was in Andaman and Nicobar Islands at Rs 40, while the cheapest was in Madhya Pradesh for Rs 24.
- The most expensive non-vegetarian thali in the same period was in Mizoram for Rs 52.40, while the cheapest was in Haryana for Rs 28.
- “Thali costs for the months of April and May are not compiled as sufficient price data was not available due to the lockdown situation of COVID-19 pandemic,” stated the survey.
- The Economic Survey 2020-21 said, “Overall, headline CPI inflation remained high during the COVID-19 induced lockdown period and subsequently, due to the persistence of supply side disruptions.
- The rise in inflation was mostly driven by food inflation, which increased to 9.1 per cent during 2020-21 (Apr-Dec).
- Due to COVID-19 induced disruptions, an overall increase in the price momentum is witnessed, driving inflation since April 2020, whereas positive base effect has been a moderating factor.
- The difference in rural-urban CPI inflation, which was high in 2019, saw a decline from November 2019 that continued in 2020.
- Inflation ranged between 3.2 per cent to 11 per cent across States/UTs in 2020-21 (Jun-Dec) compared to (-) 0.3 per cent to 7.6 per cent in the same period last year.
- Thali prices for both vegetarian and non-vegetarian Thalis declined significantly in January-March 2020 before rising sharply during April to November in both rural and urban areas before easing in December 2020.
- The easing in CPI-C is expected to ease Thali prices going forward.”
- Amid the pandemic, thali prices exhibited significant variation among the states.
- The Economic Survey, however, said that the easing of CPI-C is expected to ease thali prices going forward.
- In June to December in the past year, the most expensive vegetarian thali in rural areas was in Andaman and Nicobar Islands at Rs 38.7, while the cheapest was in Uttar Pradesh for Rs 23.10.
- The most expensive non-vegetarian thali in the same period as in Arunachal Pradesh for Rs 48.50, while the cheapest was in Chandigarh for Rs 29.90.
- When it comes to urban areas, the most expensive vegetarian thali in June-December period was in Andaman and Nicobar Islands at Rs 40, while the cheapest was in Madhya Pradesh for Rs 24.
- The most expensive non-vegetarian thali in the same period was in Mizoram for Rs 52.40, while the cheapest was in Haryana for Rs 28.
- “Thali costs for the months of April and May are not compiled as sufficient price data was not available due to the lockdown situation of COVID-19 pandemic,” stated the survey.
Shift in Thali dynamics:
- The Economic Survey 2020-21 said, “Overall, headline CPI inflation remained high during the COVID-19 induced lockdown period and subsequently, due to the persistence of supply side disruptions.
- The rise in inflation was mostly driven by food inflation, which increased to 9.1 per cent during 2020-21 (Apr-Dec).
- Due to COVID-19 induced disruptions, an overall increase in the price momentum is witnessed, driving inflation since April 2020, whereas positive base effect has been a moderating factor.
- The difference in rural-urban CPI inflation, which was high in 2019, saw a decline from November 2019 that continued in 2020.
- Inflation ranged between 3.2 per cent to 11 per cent across States/UTs in 2020-21 (Jun-Dec) compared to (-) 0.3 per cent to 7.6 per cent in the same period last year.
- Thali prices for both vegetarian and non-vegetarian Thalis declined significantly in January-March 2020 before rising sharply during April to November in both rural and urban areas before easing in December 2020.
- The easing in CPI-C is expected to ease Thali prices going forward.”
